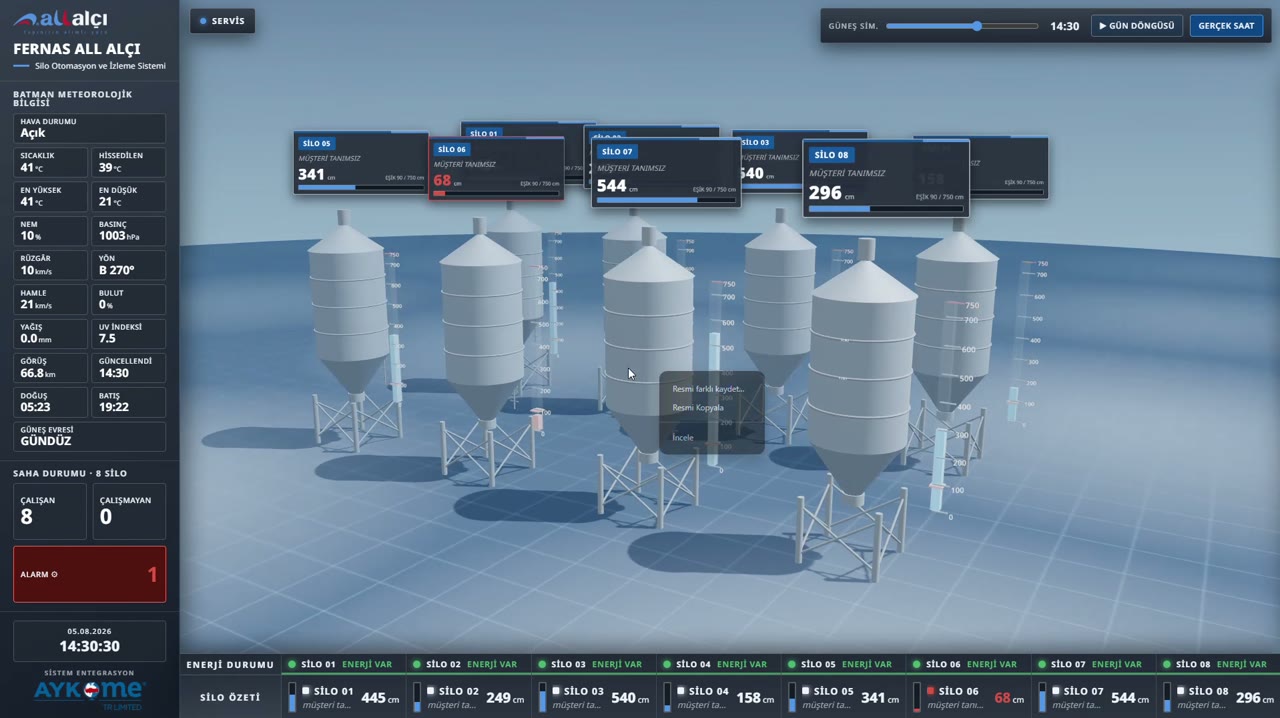
The real test of an automation solution appears not at the first plant where it is installed, but at the second one. After the silo monitoring system we commissioned at All Alçı's Gölbaşı plant proved itself in the field, the same approach was reconsidered for the Batman plant.
This time the goal was not to copy a working project, but to distil what had been learned from it into a sharper version that could be commissioned faster. The system we built for the Batman plant as Aykome Engineering brings all 8 silos together on a single control screen, complete with three-dimensional visualization and filling safety.
3D monitoring – not reading the field, but seeing it
Modelling the silos in three dimensions on screen was again placed at the centre of the design in this project:
- Each silo was modelled on screen in its real form.
- The fill level rises and falls volumetrically inside the silo; the operator does not interpret a number but sees the fill directly.
- A silo approaching a critical level is instantly highlighted on the 3D model with colour codes.
Gathered onto a single page, the 8 silos turned into a control dashboard on which the entire field can be read at a glance with 3D visualization. An operator new to the screen grasps the situation within seconds; the training burden drops noticeably.
Silo-tanker safety system – overfilling is no longer possible
The most expensive mistake in silo filling is overfilling: overflowing product, a contaminated site, an operator at risk. In this project, overflow was taken out of the realm of a mere warning and turned into a physical safety layer:
- A defined filling level was set for each silo.
- When the silo reaches this level, the system engages and does not allow the silo-tanker (silobas) operator to load.
- Safety does not depend on the operator's attention or on making the right decision at the right moment; the system enforces the decision itself.
Product loss, site contamination and occupational-safety risk are thus eliminated at the source. This is the point that moves the project from a monitoring application to a protection system.
Operator-defined alarm thresholds
Alarm limits were not hard-coded into the software. Two separate thresholds can be defined for each silo directly from the screen:
- Warning threshold (cm): When the level drops below this value, a yellow warning is triggered; early notice for delivery planning.
- Alarm threshold (cm): The critical limit. A red warning and horn are triggered.
Because each silo has a different capacity, customer and consumption rate, this flexibility proved decisive. The early-warning limit can be kept high for a silo at a busy site, while a lower limit can be set for a site with slow consumption. Changing a threshold requires no engineering support or software update; the operation applies its own decision itself.
Silo card: location, customer and power in one place
Each silo is shown on screen together with its full operational context:
- Instant fill level (cm and %)
- The silo's location / position in the field
- Customer / company name
- Contact person
- Contact / phone number
- Power on / off status and communication health
When a low-level silo is seen, the person to call and the site to visit are ready on the same screen. The information is not kept in a separate Excel file or in an employee's memory, but inside the system.
Power on/off information – knowing the reason for the silence
At remote sites, when no data flows the real question is "is the silo empty, or is the site simply silent?" The system monitors the power on/off information separately for each silo:
- A silo that loses power is marked with a distinct status on screen.
- A power outage is distinguished from a communication problem.
- The team knows what the problem is before going to the field; needless trips are eliminated.
Three-level alarm system and field warning
- Green: Level within the safe range.
- Yellow: Warning threshold exceeded; time to plan.
- Red + horn: Alarm threshold exceeded; urgent delivery required.
The warnings run both on the central screen and as a physical lamp and horn on the field panel. Critical situations are reported automatically to the relevant people; even at hours when no one is watching the screen, the system keeps talking.
Reporting – making delivery plannable
- Silo-based consumption reports: How fast each site consumes is revealed with historical data.
- Delivery history: When and how often each silo was supplied is recorded.
- Periodic comparison: Delivery can be planned in advance over daily and monthly trends.
- Site-health reports: Where power and communication outages concentrate can be seen.
With the reports, delivery moves from reacting to incoming phone calls to a pre-planned operation.
Environmental information on screen
The SCADA control screen also shows current weather information, provided through a service that runs periodically on the server side. When making delivery decisions, field and road conditions can be seen on the same screen; this data is collected on the server side without opening any outbound connection from the screen, in line with security policies.