In crushing-and-screening plants, production loss most often arises not from major breakdowns but from short stoppages whose total no one keeps. A tertiary crusher waiting twenty minutes during a shift, a screen brought online late, or a feeder running empty does not draw attention on its own; yet these are the real reason for falling below the tonnage target at month-end.
The SCADA system we developed for Tam Taş as Aykome Engineering makes these invisible losses measurable by monitoring the plant end to end. The system answers not only "which equipment is running" but also how many times and how many hours each piece of equipment ran, how many trucks came to the plant, and how much capacity was produced today.
Shift-based equipment monitoring
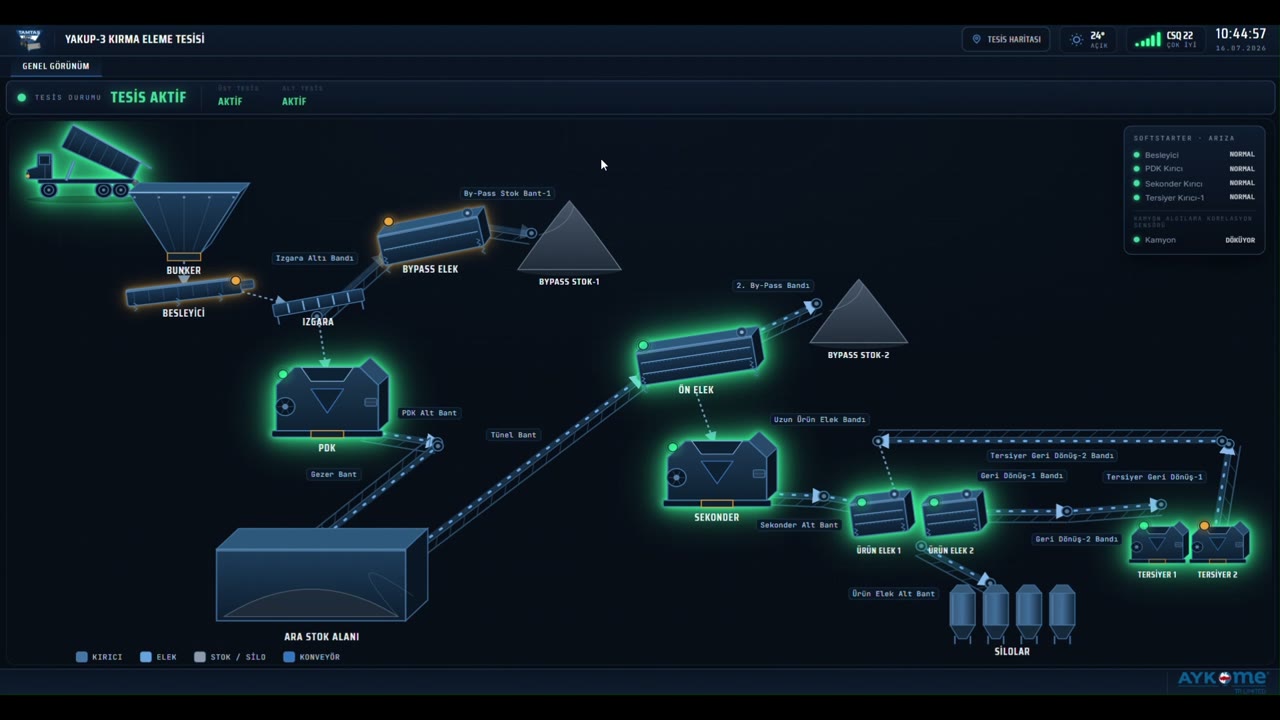
The plant's entire production line was modelled according to the flow order. Throughout the 1st and 2nd shift hours, the running status of all equipment is monitored without interruption:
- Feeder
- PDK Crusher (primary)
- Secondary Crusher
- Tertiary Crusher‑1 and Tertiary Crusher‑2
- Pre-screen and Bypass Screen
- Product Screen‑1 and Product Screen‑2
Two separate indicators are kept for each piece of equipment:
- Run count: How many times the equipment engaged and stopped within the shift. Equipment that starts and stops frequently is the earliest indicator of an imbalance at that point of the line.
- Operating hours: The equipment's total running time. The durations are accumulated to second precision and reflected on screen in an "X h Y min" format the operator can read directly; there is no need to deal with the raw counter value.
The data is segmented according to the plant's real shift arrangement. The system automatically determines the active shift and tags each record with date + shift information; the data does not get mixed up even in shifts that cross midnight. Performance comparisons can thus be made over real shift boundaries rather than the calendar day.
Truck approach and unload counting
The topic where the project goes beyond a classic SCADA application was truck tracking done with field instruments. While the plant is active:
- How many trucks approached is counted in real time.
- How many times unloading was done is monitored as a separate counter.
These two data points make the relationship between the production line's feed and the material arriving at the site directly visible. At the end of the shift, the question "how many runs came, how much was unloaded, how much of it did the line process" is answered by a counter rather than a guess.
Debounce (filtering) logic that prevents miscounting
The biggest risk in field counting is a single movement being counted more than once. A manoeuvring truck, vibration or short-lived signal fluctuations distort the report when they are not filtered.
For this reason, a valid-delay (debounce) logic was added to the system. For a signal to turn into a count, it must remain stable for a defined duration; momentary spikes and repeated triggers do not enter the count. The same approach was also applied to the equipment start‑stop counters; so both the truck counts and the run counts reflect reality.
A report is worth only as much as its accuracy. This filtering layer is the reliable ground for all reporting in the project.
Daily, monthly and yearly capacity reports
Based on the operating hours of specific instruments, the plant's capacity reports are produced automatically:
- Daily capacity report: Capacity produced on a shift and day basis.
- Monthly capacity report: Periodic total and day-to-day comparison.
- Yearly capacity report: Seeing seasonal and yearly trends.
The reports are also presented directly to the operator as a daily report and a historical report; there is no need to keep a separate table or calculate by hand. Management can see the plant's real capacity limit with data, and which equipment is pulling that limit down.
Screen architecture
The system was built on four main screens:
- SCADA Entry Screen: The plant's general status, live summary information and navigation.
- Overview: The instant status of crushers, screens and feeders on a flow diagram; run counts and durations.
- Daily Trend: The running/stoppage distribution during the day; visual tracking of which equipment stopped at which hour.
- Historical Trend: Retrospective comparative analysis; performance comparison across shifts and days.
The trend screens are where the project turned from a monitoring tool into a decision-support tool. Stoppages are no longer remembered but events that can be shown on a graph.
Communication infrastructure
- The Modbus TCP/IP protocol was used; the existing control hardware in the field was preserved and integrated into the system.
- Data transfer is provided over a GSM line; there was no need to run a separate wired infrastructure to the plant.
- At points where the signal level is weak, high-gain antennas were used to strengthen reception quality and minimize communication drops.
- The liveness of the connection is monitored continuously by the system; when the data flow is interrupted, the values on screen are distinguished as "old data", so the operator does not make a wrong decision by looking at a frozen screen.
Dual-verification operation
At a remote site, an internet outage is not a possibility but something that will certainly occur over time. For this reason, the project was designed to be outage-resistant from the start:
Data and scenarios are kept active both on the SCADA system and on the PLC. When the connection drops, the plant keeps running and counting with its own logic on the PLC; when the connection returns, the two sides re-synchronize.
The result: an internet outage neither stops production nor leaves a gap in the reports.